A Pivot Table in ServiceNow is a reporting tool that allows users to summarize and analyze data from ServiceNow records. It helps in transforming large datasets into meaningful insights by organizing data into rows and columns, enabling users to visualize and compare data easily.
You can find my YouTube link on this topics : https://youtu.be/nsbZCQHNDCI
We have two type of Pivot table:
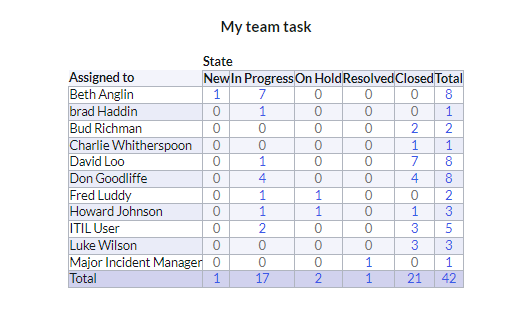
Pivot Table that contains single line pivot table. You can see sample example of how it will look like.
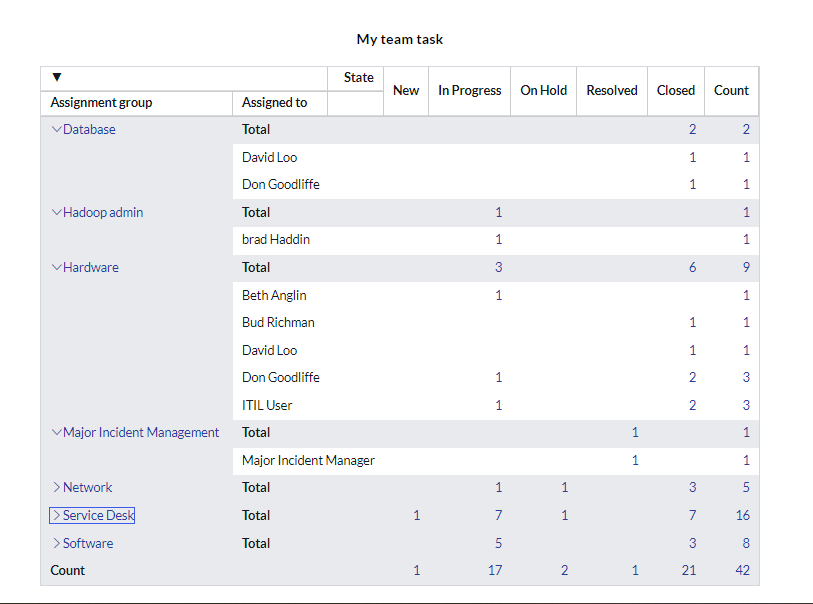
Multi-Dimensional Pivot You can select multiple fields and show with more group-by and drill-down options you will see the below images.